I love me a good graph: I have the NOAA CO2* concentration graphs bookmarked in my browser so I can watch the seasonal fluctuations of carbon dioxide as the graph inches ever upward. But most people aren’t a massive nerd like I am. So how do you make data more readable or visible or beautiful?
This was a question that was posed at last month’s SXSW Eco conference at several sessions with some pretty cool examples.
At the session on making carbon visible in cities, the video of the carbon emitted in a day in New York City was definitely my favorite. Each ton of carbon is shown in the video as a blue ball and they quickly pile up over the animated NYC until the pile becomes a mountain that almost covers the Empire State Building.
One day’s carbon emissions in NYC (CarbonVisuals)
The video was created by CarbonVisuals and even includes the math for how the size of the carbon spheres was calculated (for nerds like me). But more importantly, it tells a story about New York and the carbon that gets burned on a standard day.
As one of the other presenters, Chip Giller who founded Grist.org, said; stories are how we create our culture and our sense of self. We tell each other stories and the stories we tell are important for how we see the world. Data can tell a story, but unless you speak spreadsheet it can be hard to read it.
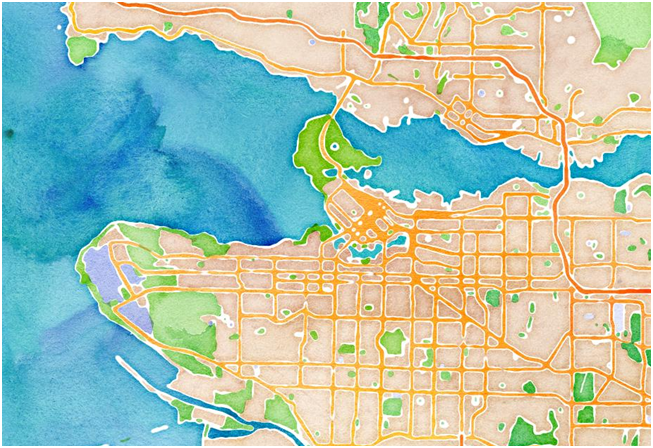
That’s where a company such as Stamen Design from San Francisco comes in. George Oates spoke at SXSW Eco about how her organization maps data–making things such as how eelgrass growth has changed in Chesapeake Bay visible. The process she described for how they work is that they first draw all the data, then they make it beautiful. She’s not kidding when she says beautiful either – there’s a tab on the map function for “watercolor.”
Vancouver Canada as watercolor by Stamen
But what do you do with information like this once you’ve got it? What’s the point in mapping trees, or eelgrass or emissions from streetlights? Well, you can’t fix the problem if you don’t have the data to know there is a problem. It’s quite easy to look at climate change or even just climate change in cities and all throw our hands in the air and say “too hard.”
Data mapping and visualization allows people to deal with large amounts of information that would otherwise be impenetrable and gives them the ability to know there is a problem and do something about it.
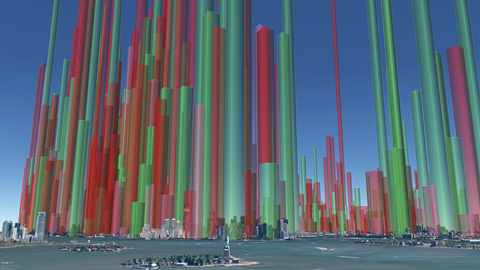
One of the more recent projects that CarbonVisuals worked on is mapping air pollution for microscopic particle soot emissions (aka PM2.5). They created a Google Earth visualization tool that showed the amount of air pollution that old heating oil burned in buildings in New York created.
Air pollution in NYC (CarbonVisuals)
This data was part of a campaign by the Environmental Defense Fund called the ‘Clean Heat Project’ and allowed EDF to see how much pollution each specific building in the area was contributing. Having that kind of data makes a much easier case for EDF to talk to a building manager about changing their type of heating oil over.
Because pretty much everything we do in life is currently organized in a way that burns carbon, and we can’t see the carbon unless it’s something like black soot, trying to make the amount of carbon we burn more visible in our daily lives can be really important for engaging people on climate change.
Data visualization makes the data easier to see, which makes the problem easier to see and makes people feel like the problem is more easily solved. All of these things are important in solving the problem of carbon pollution and climate change, so let’s all start making our data more beautiful!
Amy Huva is a research assistant for Climate Access. She is also founder of the Read the Science blog.

.png)


